The Avenues... South Redondo...
Redondo Beach is a unique market within the Beach Cities real estate market. North Redondo is the most affordable area of all the Beach Cities. It is the point of entry for many buyers who want to live within biking distance of the water but can't afford the home prices in Manhattan, Hermosa or South Redondo.
South Redondo is the oldest of the Beach areas and still maintains a number of homes built in the "teens" - '30's. Many have been well maintained over the years and can be viewed during the Redondo Historical Homes tour. Sadly others are destined for the wrecking ball due to years of neglect. Generally South Redondo home prices are lower then Manhattan and Hermosa for two reasons... commute time and non-conforming zoning in most of the residential areas.
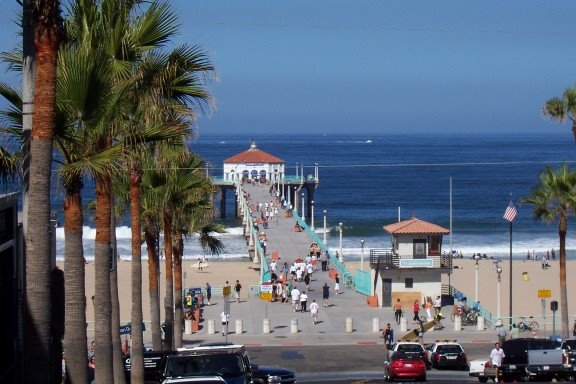
The Avenues in South Redondo feature classic examples of the types of architecture that were common in so much of Southern California through the 1950's. These streets are wide and are just a short walk to the sand.
North Redondo is often the precursor to the direction of home prices ... either up or down around the Beach Cities. It is the entry level buyer who often determines when prices begin an upswing and when the cycle stops. The upper level may sustain price increases in some areas but the entry level buyer signals price comfort levels. In 2006, the North Redondo townhome market virtually came to a halt for 4 months as entry level buyers began to question the market. While sales picked up in the spring of 2007, the handwriting was on the wall... so to speak.
As real estate prices in Manhattan and Hermosa are hovering between 2005/2004 prices, both North and South Redondo have seen home prices decline to 2004/2003 prices with sales volume well below those years. If you are trying to "time" the market it might be a smart move to keep an eye on this often overlooked segment of the market. While the Manhattan Beach home market is often the last to drop and the first to recover; the North Redondo market usually gives a clue to where the overall market is headed when it begins to stabilize.
Redondo Beach: Sold January-June 2000-2009
South Redondo: Sold January-June 2000-2009(click on graph to enlarge)
North Redondo: Sold January-June 2000-2009


2 comments:
Thanks for the latest charts. The Manhattan, Hermosa and Redondo charts you've posted all seem to suggest the same thing--prices are lower, but sales volume is still headed downwards, ergo, in the absence of some pretty extreme government intervention, we're still on the downslide. But you seem to be avoiding drawing any conclusions. Can you be coaxed at this point to venture a new prediction as to what percent off the peak the beach markets are likely to stabilize at--and/or how far back in time the beaches are ultimately going to go?
Anonymous 3:35,
I'm going to do a post trying to tie all the stats together but I'm going to honest and tell you I'm just not sure when or where the market will stabilize.
Not only do you have the unemployment issue (one month is not a trend) but consumer spending continues to be low, oil prices are on the upswing and interest rates have to go up at some point.
It would be nice if something enlightening would jump at me as I review the information for the beach cities.
Sometimes it's good to look at where you have been before trying to decide where you are going..
Post a Comment